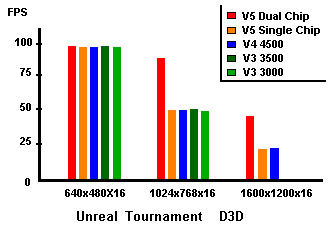
| Unreal Tournament - D3D v4.36, Thunder.dem, all detail and lighting settings maximum.
| UT-D3D |
V5 (2) |
V5 (1) |
V4 |
V3 (166) |
V3 (183) |
| 640x480x16 |
95.74 |
93.33 |
92.49 |
92.56 |
94.18 |
| 1024x768x16 |
85.80 |
48.51 |
48.68 |
47.78 |
50.73 |
| 1600x1200x16 |
44.80 |
19.86 |
20.45 |
failed |
failed |
And the Details:
V5 5500 (2)
640x480x16 = min: 57.37 max: 191.81 avg: 95.74
1024x768x16 = min: 52.12 max: 120.60 avg: 85.80
1600x1200x16 = min: 22.59 max: 61.64 avg: 44.80V5 5500 (1)
640x480x16 = min: 57.92 max: 143.13 avg: 93.33
1024x768x16 = min: 25.21 max: 64.47 avg: 48.51
1600x1200x16 = min: 8.84 max: 29.21 avg: 19.86
V4 4500
640x480x16 = min: 56.46 max: 144.04 avg: 92.49
1024x768x16 = min: 23.50 max: 66.68 avg: 48.68
1600x1200x16 = min: 8.81 max: 29.81 avg: 20.45
V3 3000
640x480x16 = min: 54.88 max: 137.07 avg: 92.56
1024x768x16 = min: 20.30 max: 66.77 avg: 47.78
V3 3000 (183MHz)
640x480x16 = min: 55.18 max: 148.64 avg: 94.18
1024x768x16 = min: 23.39 max: 69.18 avg: 50.73 |
Pretty amazing that the D3D
performance mirrors GLIDE in the benchmarks. It just goes to show that the updating
and patches really improved the game in this API. The trend in nearly identical V3
and V4 clock per clock performance also continues. And again, the V3 at 3500 speed
is faster in rendering this API than a V4, just like it was in GLIDE. Interestingly, the
V3 would not allow game play or benchmarks at 1600x1200 resolution with the WHQL drivers
in D3D for this title. I'm not sure if this was a driver problem, an instability due
to an overclocked AGP bus, or if the V3 just didn't have the available memory to run at
this resolution in D3D in this game. Since most people will prefer to play in
resolutions that afford greater FPS anyway, I wasn't to concerned with this. But
realize the fact that only 16MB of SDRAM may limit the V3 in situations where the V4 can
perform just fine.
3DMark2000
Default benchmark (1024x768x16). 3DMark
grades on a weighting scale, and you can't just look at the final score and conclude one
card is superior to another. One of the nice things about 3DMark2000 is the ability
to list all results, just not the final score which is vague at best. 3DMark has
built in game demo benchmarks, which are excellent for testing D3D performance. The
program also lists things like single and multi-texture fill rate, texture rendering
speed, and polygon count. And if anyone is wondering, I never run 3DMark2001, since
it's been proven to be biased against 3dfx cards and non-TnL cards in general.
| 3DM2K |
V5 (2) |
V5 (1) |
V4 |
V3 (166) |
V3 (183) |
| Score |
5001 |
3176 |
3257 |
3328 |
3501 |
RESULTS - V5 5500 (Fastest)
Platform: Internal
3DMark Result: 5001 3D marks
CPU Speed: 297 CPU 3D marks
Game 1 - Helicopter - Low Detail: 105.3 FPS
Game 1 - Helicopter - Medium Detail: 68.4 FPS
Game 1 - Helicopter - High Detail: 27.6 FPS
Game 2 - Adventure - Low Detail: 110.6 FPS
Game 2 - Adventure - Medium Detail: 66.2 FPS
Game 2 - Adventure - High Detail: 38.6 FPS
Fill Rate (Single-Texturing): 516.4 MTexels/s
Fill Rate (Multi-Texturing): 591.0 MTexels/s
High Polygon Count (1 Light): 5556 KTriangles/s
High Polygon Count (4 Lights): 4832 KTriangles/s
High Polygon Count (8 Lights): 4139 KTriangles/s
8MB Texture Rendering Speed: 335.0 FPS
16MB Texture Rendering Speed: 329.1 FPS
32MB Texture Rendering Speed: 259.3 FPS
64MB Texture Rendering Speed: 147.5 FPS
----------------------------------------------------RESULTS - V5 5500 (Single)
Platform: Internal
3DMark Result: 3176 3D marks
CPU Speed: 296 CPU 3D marks
Game 1 - Helicopter - Low Detail: 59.4 FPS
Game 1 - Helicopter - Medium Detail: 41.8 FPS
Game 1 - Helicopter - High Detail: 18.8 FPS
Game 2 - Adventure - Low Detail: 57.5 FPS
Game 2 - Adventure - Medium Detail: 50.5 FPS
Game 2 - Adventure - High Detail: 36.7 FPS
Fill Rate (Single-Texturing): 253.8 MTexels/s
Fill Rate (Multi-Texturing): 310.5 MTexels/s
High Polygon Count (1 Light): 4888 KTriangles/s
High Polygon Count (4 Lights): 4745 KTriangles/s
High Polygon Count (8 Lights): 4168 KTriangles/s
8MB Texture Rendering Speed: 155.6 FPS
16MB Texture Rendering Speed: 152.7 FPS
32MB Texture Rendering Speed: 128.7 FPS
64MB Texture Rendering Speed: 121.3 FPS
----------------------------------------------------
RESULTS - V4 4500
Platform: Internal
3DMark Result: 3257 3D marks
CPU Speed: 306 CPU 3D marks
Game 1 - Helicopter - Low Detail: 60.2 FPS
Game 1 - Helicopter - Medium Detail: 42.9 FPS
Game 1 - Helicopter - High Detail: 20.0 FPS
Game 2 - Adventure - Low Detail: 58.2 FPS
Game 2 - Adventure - Medium Detail: 52.0 FPS
Game 2 - Adventure - High Detail: 38.1 FPS
Fill Rate (Single-Texturing): 253.9 MTexels/s
Fill Rate (Multi-Texturing): 309.6 MTexels/s
High Polygon Count (1 Light): 5285 KTriangles/s
High Polygon Count (4 Lights): 4899 KTriangles/s
High Polygon Count (8 Lights): 4208 KTriangles/s
8MB Texture Rendering Speed: 156.6 FPS
16MB Texture Rendering Speed: 154.1 FPS
32MB Texture Rendering Speed: 129.7 FPS
64MB Texture Rendering Speed: 123.5 FPS
----------------------------------------------------
RESULTS - Voodoo3 3000 (166)
Platform: Internal
3DMark Result: 3328 3D marks
CPU Speed: 314 CPU 3D marks
Game 1 - Helicopter - Low Detail: 62.9 FPS
Game 1 - Helicopter - Medium Detail: 45.5 FPS
Game 1 - Helicopter - High Detail: 20.8 FPS
Game 2 - Adventure - Low Detail: 58.6 FPS
Game 2 - Adventure - Medium Detail: 52.0 FPS
Game 2 - Adventure - High Detail: 37.6 FPS
Fill Rate (Single-Texturing): 162.2 MTexels/s
Fill Rate (Multi-Texturing): 319.1 MTexels/s
High Polygon Count (1 Light): 4156 KTriangles/s
High Polygon Count (4 Lights): 3702 KTriangles/s
High Polygon Count (8 Lights): 3307 KTriangles/s
8MB Texture Rendering Speed: 139.9 FPS
16MB Texture Rendering Speed: 137.5 FPS
32MB Texture Rendering Speed: 119.5 FPS
64MB Texture Rendering Speed: 33.0 FPS
----------------------------------------------------
RESULTS - Voodoo3 3000 (183)
Platform: Internal
3DMark Result: 3501 3D marks
CPU Speed: 312 CPU 3D marks
Game 1 - Helicopter - Low Detail: 67.0 FPS
Game 1 - Helicopter - Medium Detail: 48.0 FPS
Game 1 - Helicopter - High Detail: 21.7 FPS
Game 2 - Adventure - Low Detail: 62.4 FPS
Game 2 - Adventure - Medium Detail: 54.2&nb3p; FPS
Game 2 - Adventure - High Detail: 38.4 FPS
Fill Rate (Single-Texturing): 174.6 MTexels/s
Fill Rate (Multi-Texturing): 342.3 MTexels/s
High Polygon Count (1 Light): 4139 KTriangles/s
High Polygon Count (4 Lights): 3734 KTriangles/s
High Polygon Count (8 Lights): 3296 KTriangles/s
8MB Texture Rendering Speed: 149.5 FPS
16MB Texture Rendering Speed: 146.8 FPS
32MB Texture Rendering Speed: 127.6 FPS
64MB Texture Rendering Speed: 34.0 FPS |
Although the V3 gets a higher
overall score than the V4 at the same clock speed, there are some interesting things to
note. The first point of interest is the nearly identical real world multi-texture
fill rate of the V5 single chip, V4, and V3, all of which are within 10 MTexels/s of one
another. The single texturing of the VSA100 is far superior to that of the V3,
although this may not mean much since almost all games in the last few years make heavy
use of multi-texturing. Also of great importance is the texture rendering speed of
the V4 as compared to the V3. Due to the large texture support of the VSA100, the V4
is able to mop the floor with the V3 in these benchmarks. The in-game benchmarks
of "Helicopter" and "Adventure" are slightly faster on the
V3 3000 even at 166MHz, but performance levels again are close enough for all the cards
(except the V5) that differences are negligable. Overall performance of the V4 and
V3 were astoundingly similar in this benchmark except for the items as noted.
[NEXT]
[Intro
| Test System/Scaling | Benchmarks | Overclocking
| Conclusion] |