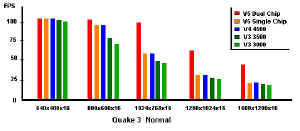
| Quake3 Arena v1.17, Demo001. This is still one of the very best overall benchmarks
by which to compare video cards. It has excellent and reliable characteristics, not
to mention the engine is still being used in the newest available games (like RTCW).
Benchmarks were made at both available high-end factory clock speeds for the
Voodoo3. A 200MHz version was also sold in the Falcon Voodoo3 3500
Special Edition, but it is a very rare card and wasn't as readily available as the
standard V3 3000 and 3500. Default "normal" settings were used for 16bit
color, and default "hi quality" settings for 32bit. The V3 wasn't tested
in the latter settings since it doesn't render in 32bit color.
| Quake3 |
V5 (2)* |
V5 (1)** |
V4 |
V3 (166) |
V3 (183) |
| 640x480x16 |
112.4 |
111.9 |
111.1 |
101.2 |
106.1 |
| 800x600x16 |
111.3 |
91.3 |
91.3 |
70.8 |
78.8 |
| 1024x768x16 |
100.8 |
58.2 |
58.1 |
46.0 |
48.9 |
| 1280x1024x16 |
68.4 |
34.1 |
34.4 |
28.2 |
29.3 |
| 1600x1200x16 |
44.2 |
22.7 |
23.1 |
19.4 |
21.7 |
| 640x480x32 |
109.0 |
95.0 |
95.8 |
- |
- |
| 800x600x32 |
103.0 |
64.2 |
66.2 |
- |
- |
| 1024x768x32 |
75.8 |
38.4 |
41.0 |
- |
- |
| *(2) V5 5500 using both
VSA100's |
| **(1) V5 5500 using single
VSA100 |
|

|
The VSA100 really slaps down the
Voodoo3 in Q3A. A combination of better OpenGL rendering and texture compression
really does the job, and the V3 just isn't even in the same ball park. Even when I
disabled Compression, I was only 2-5FPS lower in each benchmark, so chalk this one up to
VSA100 superiority. Are there other factors here? Who knows, but VSA100 is
definitely the undisputed top dog.
Notice how the V5 in Single Chip mode is nearly
identical to the V4 4500, especially in 16bit. This makes perfect sense, since if
you halve every V5 specification you have a V4. It's good to know that if one of
your VSA100 chips goes south on your V5, you can still use it as a make-shift V4
4500. The rest of the benchmarks confirm that the V4 4500 and the V5 5500 are
extremely close in overall performance. The only noteworthy deviance from this was
that the V4 4500 had a slight edge over the V5 single chip in 32bit color. But as
you can tell from the Q3A benchmarks, we're talking a few FPS difference at most.
Unreal Tournament - GLIDE
v4.36, Thunder.dem, all detail and lighting
settings maximum. This is one great game, but it sure leaves alot to be desired as
a game benchmark. The Unreal Engine simply is very CPU dependant, and it doesn't
scale to resolution as well as Q3A. That is until Reverend came out with his
Thunder.dem demo, which provides a more realistic representation of in-game performance
and resolution scaling. You can download the Thunder.dem for
yourself and benchmark UT as it was meant to be, in-game.
| UT-GLIDE |
V5 (2) |
V5 (1) |
V4 |
V3 (166) |
V3 (183) |
| 640x480x16 |
97.58 |
91.25 |
91.0 |
89.85 |
93.55 |
| 1024x768x16 |
86.93 |
47.21 |
47.48 |
45.66 |
51.09 |
| 1600x1200x16 |
44.68 |
21.42 |
21.71 |
21.56 |
25.50 |
If you prefer the gory details:
V5 5500 (2)
640x480x16 = min: 58.38 max: 189.92 avg: 97.58
1024x768x16 = min: 52.41 max: 136.15 avg: 86.93
1600x1200x16 = min: 15.9 max: 66.67 avg: 44.68V5 5500 (1)
640x480x16 = min: 59.75 max: 141.38 avg: 91.25
1024x768x16 = min: 21.52 max: 69.60 avg: 47.21
1600x1200x16 = min: 9.53 max: 31.18 avg: 21.42
V4 4500
640x480x16 = min: 58.16 max: 137.92 avg: 91.0
1024x768x16 = min: 18.83 max: 68.33 avg: 47.48
1600x1200x16 = min: 9.97 max: 31.57 avg: 21.71
V3 3000
640x480x16 = min: 60.06 max: 138.21 avg: 89.85
1024x768x16 = min: 17.13 max: 66.77 avg: 45.66
1600x1200x16 = min: 9.42 max: 35.75 avg: 21.56
V3 3000 (183MHz)
640x480x16 = min: 59.40 max: 153.93 avg: 93.55
1024x768x16 = min: 19.72 max: 74.92 avg: 51.09
1600x1200x16 = min: 10.87 max: 39.19 avg: 25.50 |
The Voodoo3 is equal to the V4 4500
in GLIDE for all practical purposes. While the V4 edges it out slightly at 166MHz,
it takes a back seat to the V3 at the factory 183MHz clock speed of the V3 3500.
All things considered, clock for clock in GLIDE the V4 and V3 average exactly 1FPS
difference at resolutions tested!
[NEXT]
[Intro
| Test System/Scaling | Benchmarks | Overclocking
| Conclusion] |